Global Demo – Overview
(We recommend viewing this video in Full-screen-modus on a Mac/PC, laptop or tablet (or at least in landscape on a smartphone / tablet)
More in detail
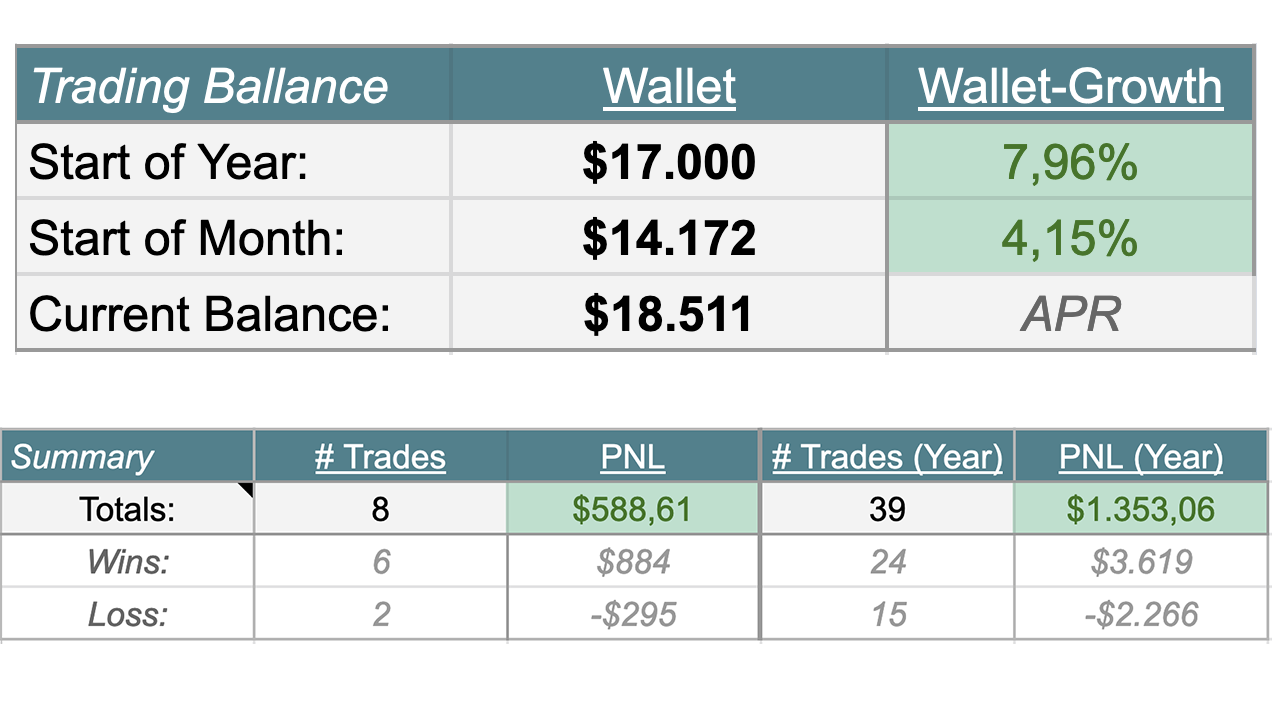
Header – Your trading results
On top of your sheet, you will always have an overiew of your trading results!
Trading Ballance:
Changes in your wallet
Time-laps: Current month & Year.
Summary of your trading-results:
How many wins vs losses (Number & PNL)
Time-laps: Current month & Year.
Lines – Startup
Start entering your trade-lines.
* After filling in your Trade Number. Automatically a lot of default-values will be loaded.
(Also quite a lot of fields that you will only see in the next movies).
* Exchange you are on with this trade.
* Date in trade (will be automatically filled in when entering the trade).
* The first check-mark (Closed) will be automatically filled in after you’ve closed a trade.
(Targets hit, SL hit or manual close of the trade)
Details of the trade
Fill in some details of your trade:
- Wallet ($): This field will be automatically filled in with the current value of your wallet (header)
- %-Risk: For proper risk-management fill in your total risk you want to take on this trade. (Filled in automatically with default value from your settings)
- Long/Short: Which direction you want to go. Long or Short?
- Leverage: If you have nog enough wallet-value available, you can add it up with some leverage.
Entries
Where you gonna enter your trade:
- Up to 3 take entry points you can fill in.
- Once an entry-point is hit check it in your trade-line.
- A line that is in trade, will be shown in blue. (so you have a clear overview which lines are in trade at the moment)
Stoploss & Max. Position
Here you define your Stoploss & automatically your max. Position size will be calculated:
- Stoploss ($): Here you fill in your Stoploss-value. (where you will go out of trade no matter what)
- Stoploss (%): Automatically this percentage will be calculated.
- Max. Position Size: Automatically your max. Position-size for this trade will be calculated. (Regarding: All points of entry, stoploss, risk-% and leverage)
- Position Size: Automatically filled in with the calculated Max. Position Size. (but editable: If you go higher than the max. Position Size, it will be shown in red to mention it to you)
- Position Size incl. leverage: if using leverage, this is the real position-size of your wallet x leverage to fill in for example in Binance.
Take Profit (%)
Here you can define:
- How many Take profit points you will define for this trade (up tot 6)
- The take profit percentages when the target is hit.
If the full 100% is devided over all your TP’s, the percentages will be shown in blue.
Target Setup
Here you can define your targets to take profit:
- 1RR (indicatief): If you like to take you first take profit on a specific RR-value, you can define this RR-value in your settings. In this field this value will be calculated automatically.
- TP1: Here you can define your first take-profit value. (If you have defined in settings that you like to take profit at a specific RR-value, the calculated RR-value wil automatically be suggested here.
- TP2 – TP6: Here you can define all your other take-profit-values.
Visibility: Depending on how much TP-targets en percentages you have defined earlier, the TP-targets to be filled in here are marked in a grey color.
- SL2BE: Stoploss to break-even. For example: After hitting your first target, you want to make this trade safe by moving your stoploss to your entry-point. Here you can check this, so your calculated results will take this into account.
Out of position & (un)realised PNL’s
Maybe the most import part of this Trading-Journal! (and where we make a difference to other Trading-journals)
Out-of-Position:
In three ways you can go out-of-position:
- Take profit (TP1 – TP6): If a target is hit, check it in your journal. In the PNL-panel you will see the result in green.
- SL Hit: If your stoploss is hit, check it here. In the PNL-panel you will see the result in red. (unless you’ve moved and checked that your SL was moved to break-even)
- Manual Close: If you decide to close the trade manually, you fill in the exit-value in here. (automatically the PNL-results will be updated too – for the remaining “bag” that you’ve closed manually now)
Fine-tune your trades (in advance!)
If you are not in trade yet… and you are defining your trade-setup: your PNL-values will also filled in here in grey.
So already by setting up your trade, you can fine-tune it:
- What’s the total PNL for the setup I want to make?
- What’s the impact on my PNL of moving my stoploss a bit lower / higher?
- What’s the impact on my PNL of taking 3 entry-points or just one?
- What’s the impact on my PNL of taking a target a bit lower / higher?
- …
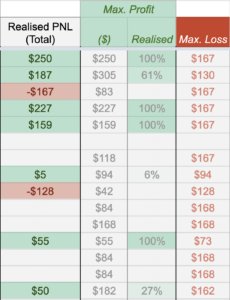
PNL – Totals
Here you can find the total realised PNL’s of closed trades.
- Realised PNL (Total): Results of al your TP’s, Stoploss and/or manual out of trade. (Red of green)
- Max. Profit ($): What is the max. possible profit this trade could give you depending on your setup you filled in.
- Max. Profit (realised): How much of your setup / total PNL is already realised.
- Max. Loss: What is the max. possible loss for this trade? (Depending on the risk-%, entries, stoploss)
Tradingview charts
Here you can paste the link to your tradingview-setups:
- Tradingview (before): Your tradingview setup before the trade has played.
- Tradingview (after): The result of the trade.
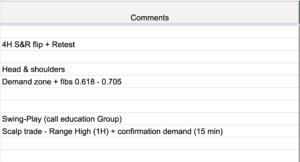
Comments
This is a noteblok for yourself to put some comments about this trade!
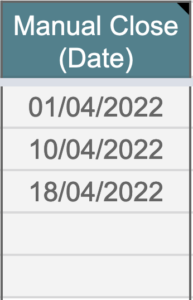
Manual Date (close)
When start using this Trading-journal, it could be nice to also register some trades from the past in it.
This is possible! Just register your trade on the correct month-tab and fill in here the closing-date of the trade.
Normally the journal closes the trade automatically when hitting: all of your targets, SL hit of a manual close of the trade.
By filling in this date, you can mention here it is a trade from the past. (relevant for your PNL’s for a specific month, the graphs,…)
Analysis
Trading Dashboard
A very nice feature to have!
- Graph: Here you can see the evolution of your PNL-results! (of you fully closed trades -> realised PNL)
- PNL-total: Here you can easily see the PNL-total realised.
Also you have some more detailed information about your trades:
- Realised PNL (wins vs losses)
- Number of wins vs losses
- Average PNL per trades (wins vs losses)
Filter: possible to filter for a specific / current month. Or to get a Year-overview.
Graphs – Details
Some more in detail graphs:
- Out-of-trade: Where you went most of the time out-of-trade? (TP1 – TP6, at SL or a manual close).
- Long/shorts: Which direction worked the best for you until now? (Long or short, PNL’s of it,…)
- Your profit (realised by currencies): What currencies where the most successful for you?
- TP1 and TP2 RR-values: On what RR-values you gained your most profits? (can be important in a specific and difficult market to define your first and second TP)
- …


